
311 Wrapped gives your ZIP code a year-end recap of complaints to the city
Public service requests become neighborhood maps in 18 US cities, with an important catch: a report count cannot tell you how many people complained.
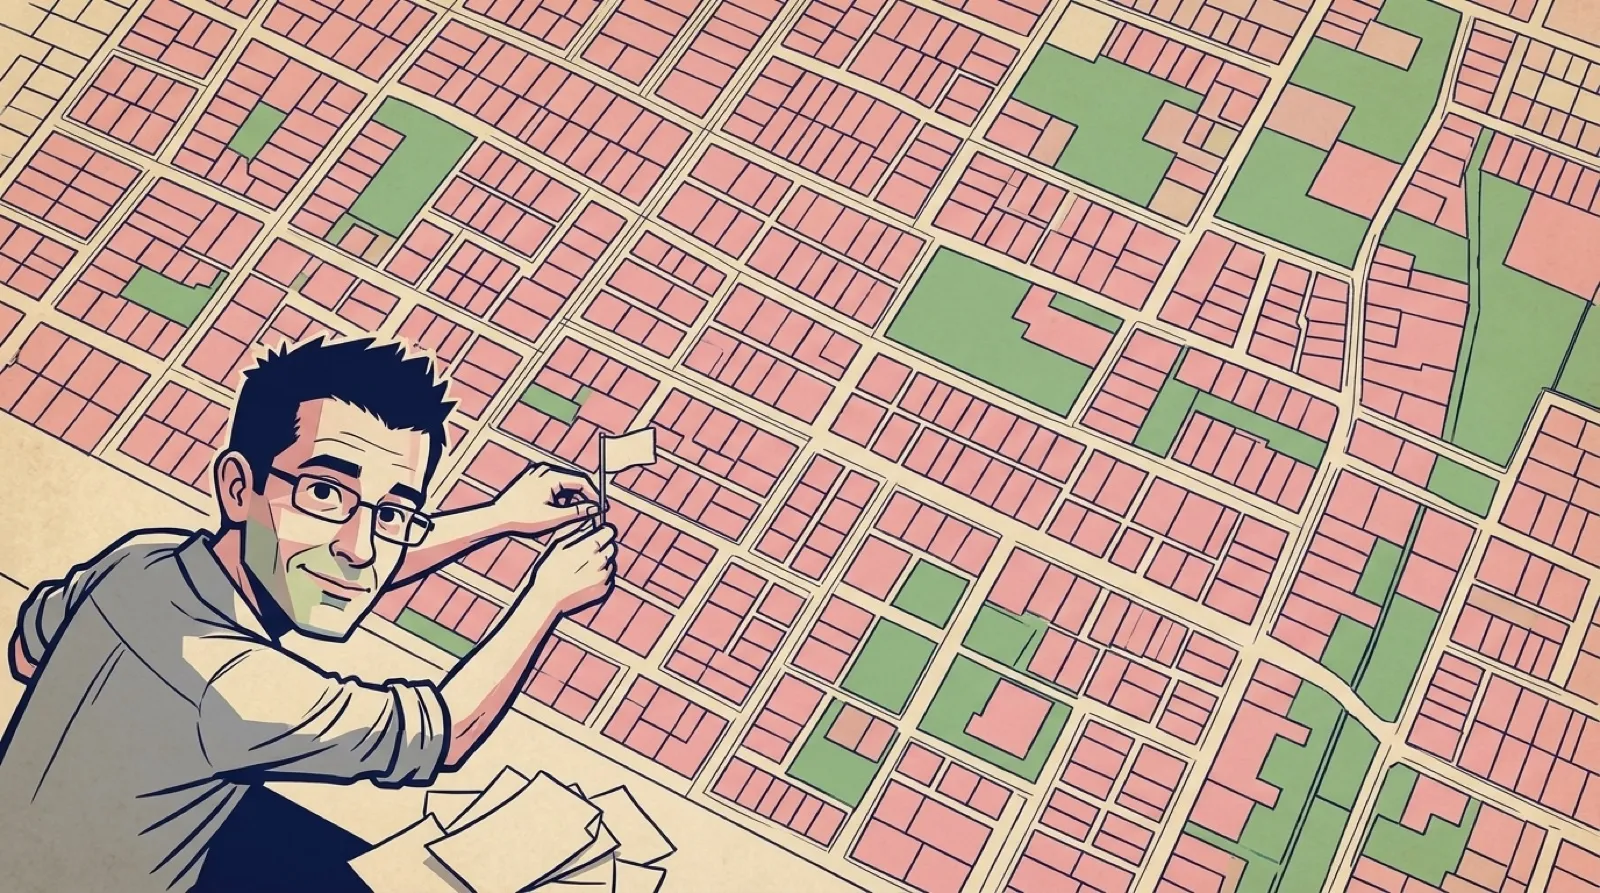
Your neighborhood gets a Wrapped now. The soundtrack may involve a pothole.
311 Wrapped takes municipal service requests and lets you explore the complaints by ZIP code. The site’s pitch is “Your ZIP. Your story.” Animated maps and reporting patterns make a city’s public records a little easier to wander through than a spreadsheet. This account comes from the tool’s own description, rather than an independent audit of its city feeds.
The tool offers two different ways to recognize a place: the city first, then the ZIP code inside it. Its current city list ranges from New York and Los Angeles to Cambridge and Cleveland. That matters before anyone types an address. A public-data application can be easy to use and still have no answer for a place outside its coverage.
The site’s comparison is with other ZIP codes in the same city. That boundary deserves to travel with a screenshot. Municipalities publish their own request records, and the tool points readers to its methodology for the sources and calculation rules. A ranking that loses its city label invites comparisons the front page never promises to support.
The playful neighborhood commentary sits alongside those records. The site explicitly separates the quips from the source numbers. A funny description can make a chart shareable, but it cannot identify who filed a request or explain why another resident stayed quiet. The most entertaining caption on the map still needs the same dull little qualifications as a spreadsheet.
A useful reading starts with one complaint category and a date range. If the chart shows a burst, the next question is whether the underlying requests concern the same location or several different ones. The map can help choose where to look; the city’s records supply the detail needed to decide what happened.
That makes this a handy model for an internal dashboard, too. A familiar label can get someone into the data faster than a database field name, provided the screen keeps the measurement visible. Calling a report a problem would silently change what the chart claims to know.
The full-year selector is especially worth keeping in view when sharing a card. A 2025 total and a 2026 total through October 24 answer different questions. The neighborhood may have changed, but the missing weeks are already enough to change the picture.
The year selector offers a full 2025 view alongside 2026 so far. Comparing those totals directly would give the older year extra months to accumulate trouble. A year-end graphic in November has to keep its calendar attached.
The interesting next step is what a resident does after finding the recurring complaint: follow it into the city’s own records and see whether the same problem keeps coming back.