
A developer’s blood-sugar benchmark finds accurate averages can conceal missed dangerous lows
Low-error predictions can still fail the event that matters most to somebody living with diabetes.
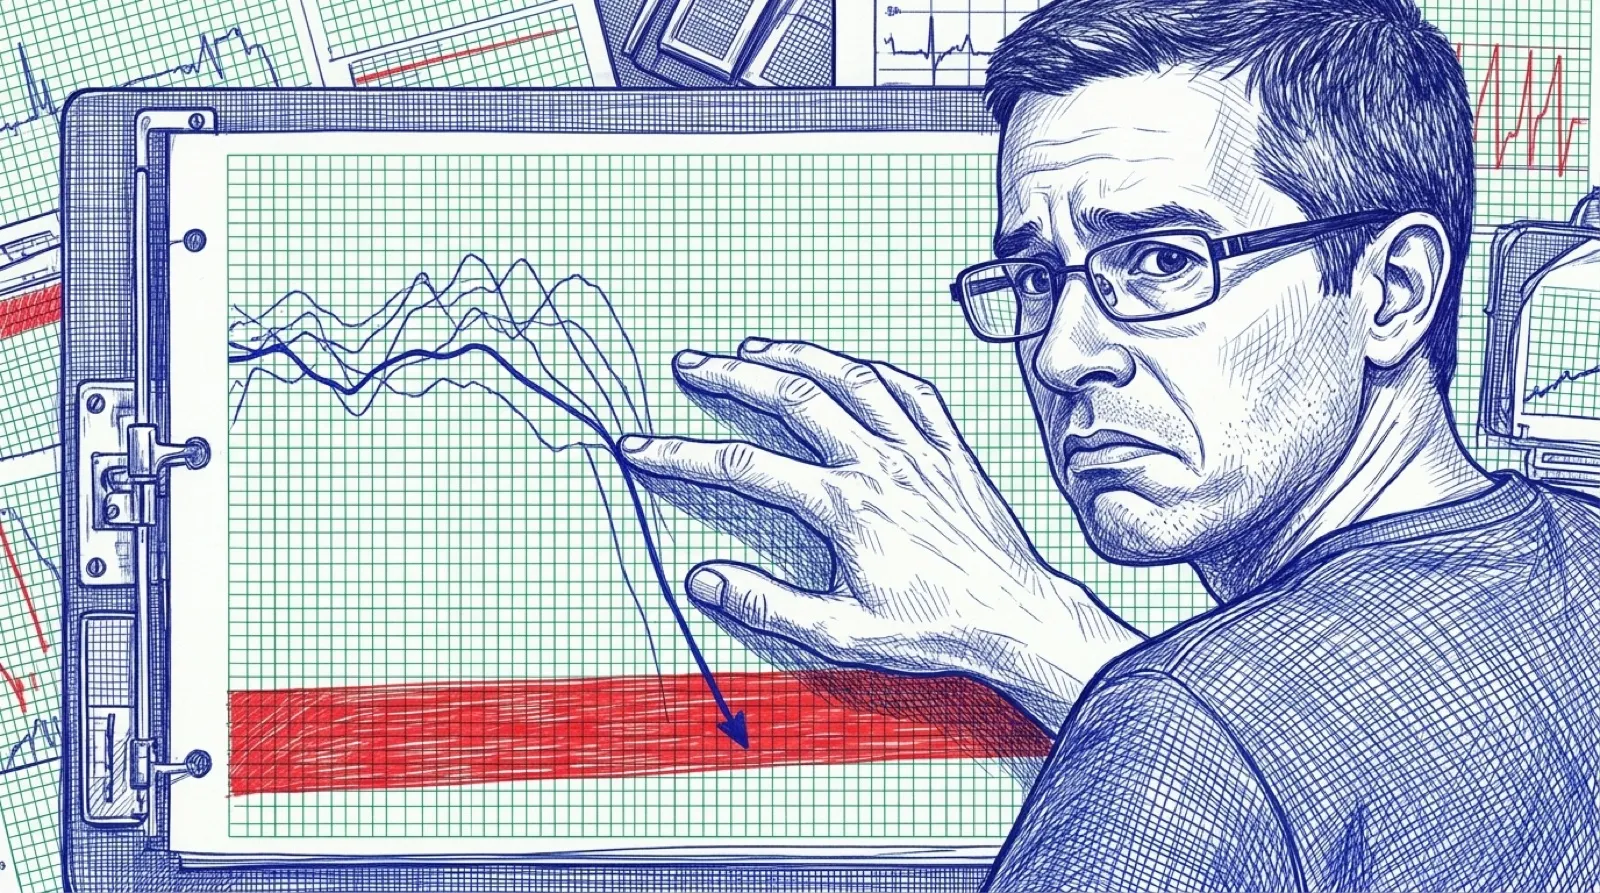
A blood-sugar forecast can win an accuracy comparison and still miss the event somebody most wanted warning about. In T1DMAI, a developer with Type 1 diabetes compared forecasting models and exposed that uncomfortable split between the average result and the dangerous exception. The report card looks much better if nobody asks about that particular question.
The author’s repository presents a research collection of 22 models. It compares personal data with the public MetaboNet dataset and reports different rankings depending on the measurement. This is the author’s own evaluation, rather than an independently replicated clinical study.
At 60 minutes on MetaboNet, the author reports 0% low-event recall for XGBoost and 6–8% for the custom transformer variants, versus 58% for linear extrapolation. Those figures describe that benchmark and horizon. They don’t establish which approach is safe for an individual, or make a simple extrapolation into a treatment tool.
The repository’s warning is direct: “Research and educational use only.” Keep that next to every screenshot of an impressive forecast. A curve that resembles the future in a retrospective chart has skipped some very inconvenient questions about what information was available at the time and what happens when it gets the important case wrong.
For people who evaluate software, the broader lesson is immediately recognizable. A metric summarizes the question somebody chose to ask. If a rare failure carries most of the cost, an average can remain excellent while the product repeatedly fails the person who needs it. Ask to see those failures separately before becoming impressed by a leaderboard.
The important move here is making the second measurement visible. A reader can inspect how the project defines events, chooses horizons and splits its data, then ask whether those choices answer the intended research question. Merely adding another decimal place to the winning score wouldn’t resolve any of that. Precision has wonderful stage presence (very scientific-looking).
The author’s personal-data result also differs from the public-data result. One ranking cannot establish a universal recommendation across patients and settings. The dataset is part of the result, and changing the people or conditions being measured can change what the ranking means. A screenshot rarely has enough room for that sentence, which is exactly why it needs one.
The most useful outcome from projects like this is a better set of evaluation questions. A small model beating a large one makes a tidy headline; showing why both can fail the event being watched gives the next researcher something concrete to improve. The unresolved work lies in those misses and in validation the project does not claim to have.
The average doesn’t get the last word.